Visualizing Song Trends on TikTok
A step-by-step guide on using data and the Spotify API to analyze viral songs from the new social media giant.


It’s been a while since a new social media platform has arrived on the scene and changed how we communicate. Facebook, Twitter, and Instagram (to varying degrees) have been the main go-to platforms for the past years. However, their ability to attract and retain younger users has been challenged.
That is of course, until TikTok arrived. Even if you are unfamiliar with the platform, it’s highly likely that you have at least heard of it. In short, TikTok is a video sharing application that allows users to upload videos of up to 60 seconds long. What makes it unique however, is the range of features that allow users to customize their videos and the ability to creatively interact with other users. The important feature to note for this article is that every video has its own “sound”. These sounds can be quite literally anything, from the sound of a screeching car to a song from a platinum album. And any user can use these sounds for their video. Interestingly, this adds another layer of potential “virility” to all content. For example, if a user uploads a video of a baby laughing hysterically, the video itself may not go full viral but the sound might. This creates the common and well-known TikTok phenomenon of people lip-synching with other users’ voices. Already existing music is also commonly used as a sound. And when many users are using the same sounds for their own videos, it’s referred to as ‘trending.’
For this article, I’ll be exploring data regarding trending songs on TikTok using a dataset complimented with audio features pulled from Spotify API. Some questions that will be addressed include, what audio features are common across all trending songs? Does the popularity of a song have any weight on if it will go viral on TikTok? Do instrumental songs perform better than songs with lyrics? Do TikTokers have a preference on the music’s decade?
The dataset was created by Eric van de Ven from Kaggle and contains information for the first 1000 songs and video pulled using an unofficial TikTok scraper. For the sake of this project, I will only be using the data from songs with Spotify IDs.
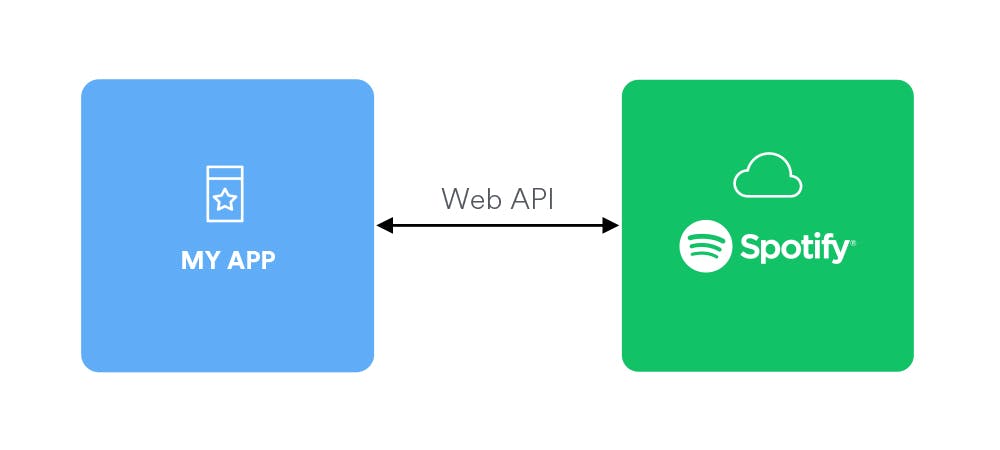 source: developer.spotify.com/documentation/web-api
The first step is to set up our Spotify API. There’s well written documentation and many articles and video tutorials on how to set up and initialize a Spotify API client to work with your application. The API can call numerous different features for any song, artist, playlist, podcast, etc. For this project, we will be using it to retrieve audio features for individual tracks. These audio features include:
Energy — The higher the value, the more energetic is considered to be. Danceability — High value songs are considered to be more danceable. Loudness — Measured in dB, the higher the value, the louder the song. Valence — Positive mood songs have higher valence. Acousticness — The more acoustics the song has, the higher the value. Release Year — The year each song was released. Popularity — The higher the value the more popular the song is.
Every object in Spotify (an artist, a song, a podcast episode, etc.) has it’s own unique identifier. The most important for us is therefore the track id. Luckily, our dataset from Kaggle already comes with the song information, including the ID. However, we will need to populate the audio features for each song ourselves. We can start by importing all the libraries we’ll need for this project.
import base64
import requests
import datetime
from urllib.parse import urlencode
import pandas as pd
from matplotlib import pyplot as plt
import numpy as np
import plotly.graph_objects as go
import plotly.offline as pyo
import scipy.stats as stats
import seaborn as sns
from matplotlib.pyplot import figure
import plotly
import plotly.express as px
from scipy.stats import norm
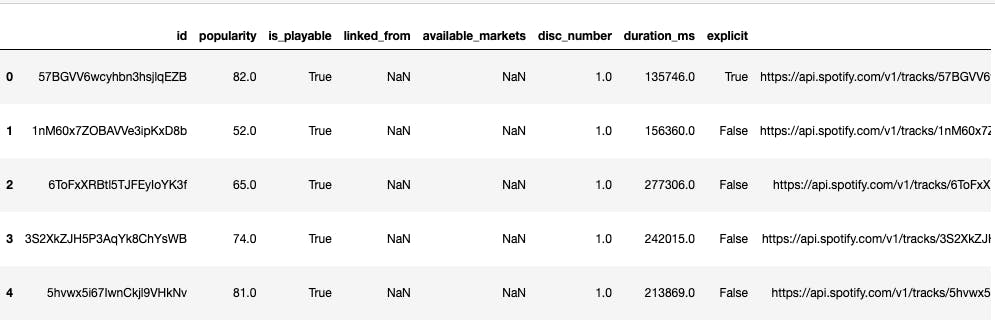
Next, we’ll upload the dataset and give it a quick look.
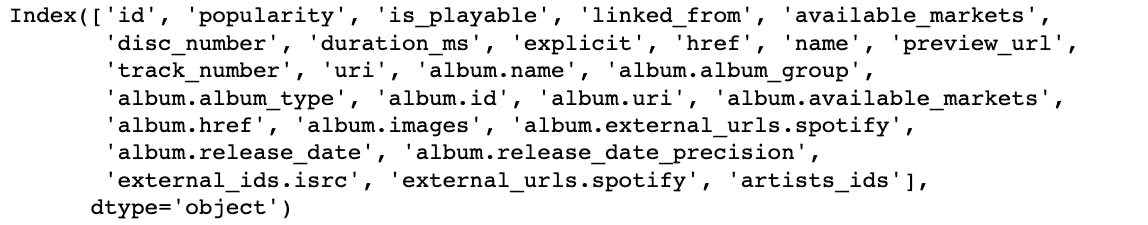
df.columns
df.info()
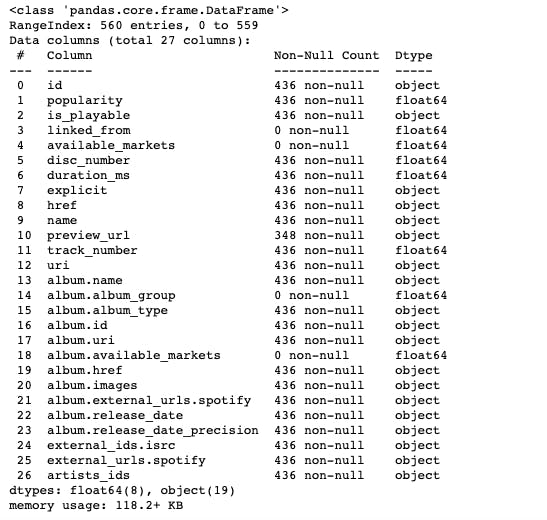
We see that there exists two ids. One for the track, and another for the album. For this project, we will need the track id to grab the audio features from Spotify. We can also tell that not every column will be needed for music analysis and that many columns may contain NaN values. We will clean and rearrange the data at a later step. Now that we have a dataset, let’s initialize our API. I wrote this code with several modifications from CodingEntrepreneurs. You will need to create a Spotify Developer account and retrieve your client_id and client_secret.
class SpotifyAPI(object):
    access_token = None
    access_token_expires = datetime.datetime.now()
    access_token_did_expire = True
    client_id = None
    client_secret = None
    token_url = "https://accounts.spotify.com/api/token"

    def __init__(self, client_id, client_secret, *args, **kwargs):
        super().__init__(*args, **kwargs)
        self.client_id = client_id
        self.client_secret = client_secret

    def get_client_credentials(self):
        """
        Returns a base64 encoded string
        """
        client_id = self.client_id
        client_secret = self.client_secret
        if client_secret == None or client_id == None:
            raise Exception("You must set client_id and client_secret")
        client_creds = f"{client_id}:{client_secret}"
        client_creds_b64 = base64.b64encode(client_creds.encode())
        return client_creds_b64.decode()

    def get_token_headers(self):
        client_creds_b64 = self.get_client_credentials()
        return {
            "Authorization": f"Basic {client_creds_b64}"
        }

    def get_token_data(self):
        return {
            "grant_type": "client_credentials"
        }

    def perform_auth(self):
        token_url = self.token_url
        token_data = self.get_token_data()
        token_headers = self.get_token_headers()
        r = requests.post(token_url, data=token_data, headers=token_headers)
        if r.status_code not in range(200, 299):
            raise Exception("Could not authenticate client.")
        data = r.json()
        now = datetime.datetime.now()
        access_token = data['access_token']
        expires_in = data['expires_in'] # seconds
        expires = now + datetime.timedelta(seconds=expires_in)
        self.access_token = access_token
        self.access_token_expires = expires
        self.access_token_did_expire = expires < now
        return True

    def get_access_token(self):
        token = self.access_token
        expires = self.access_token_expires
        now = datetime.datetime.now()
        if expires < now:
            self.perform_auth()
            return self.get_access_token()
        elif token == None:
            self.perform_auth()
            return self.get_access_token()
        return token

    def get_resource_header(self):
        access_token = self.get_access_token()
        headers = {
            "Authorization": f"Bearer {access_token}"
        }
        return headers


    def get_resource(self, lookup_id, resource_type='albums', version='v1'):
        endpoint = f"https://api.spotify.com/{version}/{resource_type}/{lookup_id}"
        headers = self.get_resource_header()
        r = requests.get(endpoint, headers=headers)
        if r.status_code not in range(200, 299):
            return {}
        return r.json()

    def get_album(self, _id):
        return self.get_resource(_id, resource_type='albums')

    def get_artist(self, _id):
        return self.get_resource(_id, resource_type='artists')

    def get_track_info_by_id(self, _id):
        ### Retrieve track information with track ID
        headers = self.get_resource_header()
        endpoint = "https://api.spotify.com/v1/tracks"
        lookup_url = f"{endpoint}/{_id}"
        r = requests.get(lookup_url, headers=headers)
        if r.status_code not in range(200, 299):
            return {}
        return r.json()


    def query_track_audio_features(self, _id):
        # Use the Spotify API call to retreive audio features (danceability, tempo, mode, etc.) from the track id
        headers = self.get_resource_header()
        endpoint = "https://api.spotify.com/v1/audio-features"
        lookup_url = f"{endpoint}/{_id}"
        r = requests.get(lookup_url, headers=headers)
        if r.status_code not in range(200, 299):
            return {}
        return r.json()

    def base_search(self, query_params): # type
        headers = self.get_resource_header()
        endpoint = "https://api.spotify.com/v1/search"
        lookup_url = f"{endpoint}?{query_params}"
        r = requests.get(lookup_url, headers=headers)
        if r.status_code not in range(200, 299):
            return {}
        return r.json()

    def search(self, query=None, operator=None, operator_query=None, search_type='artist' ):
        if query == None:
            raise Exception("A query is required")
        if isinstance(query, dict):
            query = " ".join([f"{k}:{v}" for k,v in query.items()])
        if operator != None and operator_query != None:
            if operator.lower() == "or" or operator.lower() == "not":
                operator = operator.upper()
                if isinstance(operator_query, str):
                    query = f"{query} {operator} {operator_query}"
        query_params = urlencode({"q": query, "type": search_type.lower()})
        return self.base_search(query_params)
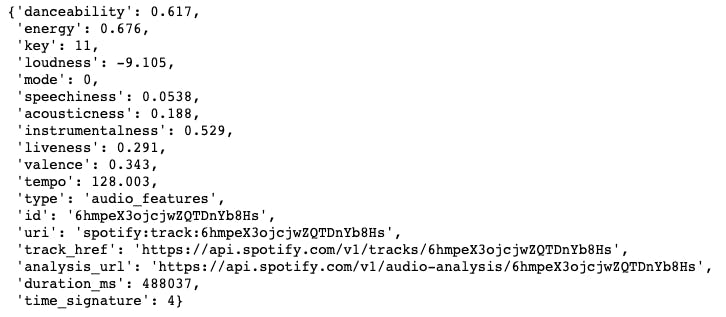
If we initialize and test the client, we can see what the API returns. The ID 6hmpeX3ojcjwZQTDnYb8Hs is for the song “Only Time Will Tell”, one of the songs on the TikTok trending list.
spotify = SpotifyAPI(client_id, client_secret)
spotify.query_track_audio_features("6hmpeX3ojcjwZQTDnYb8Hs")
We will need only the numeric values of the audio features for our use-case. There are also numerous columns in the original dataset that are not useful for immediate or future analysis such as linked_from, available_markets, album.album_name_group, etc. We will remove those, however since other trends may be discovered later, we will still keep things such as “explicit”, “duration”, and “popularity”. Links, urls, artist_ids and some others will still be kept in case we wanted to grab images or create Spotify widgets.
Data Cleaning and Pre-Processing
df.drop_duplicates(inplace=True)
# Only keep rows where the track ID is present
df = df[df['id'].notna()]
# Drop unneccessary columns
df.drop(['album.album_group', 'album.release_date_precision', 'album.available_markets', 'linked_from', 'external_ids.isrc', 'external_urls.spotify', "available_markets", "disc_number"], axis=1, inplace=True)
df = df.reset_index(drop=True)
Now we will use our track ids and our query_track_audio_features function to retrieve our audio features and add them to the dataframe.
df["audio_features"] = df["id"].apply(spotify.query_track_audio_features)
audio_features_df = pd.DataFrame(list(df["audio_features"]))
audio_features_df.head()
We can concatenate this audio feature dataframe to our original one.
df = pd.concat([df, audio_features_df], axis=1)
df = df.loc[:,~df.columns.duplicated()]
Does popularity on Spotify translate into popularity on TikTok?
If we sort our dataframe by popularity, who are the most popular Spotify artists on the trending list and who are the least?
popularity_sorted_df = df.sort_values('popularity', ascending = False)
popularity = popularity_sorted_df['popularity']
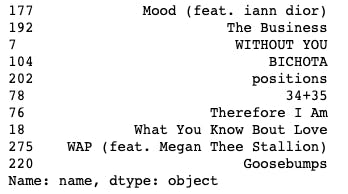
popularity_sorted_df['name'].head(10)
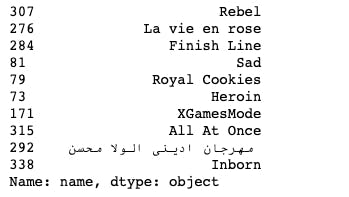
popularity_sorted_df['name'].tail(10)
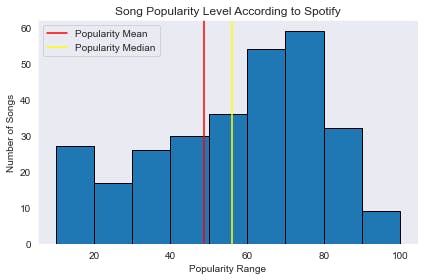
The highest popularity value is 95 (out of 100) and the lowest popularity is 0. The 10 most famous Spotify songs that were trending on TikTok are:
The 10 least famous Spotify songs that were trending on TikTok are:
The average score of a trending song was 48.66. We can visualize this using matplotlib.
mean_popularity = popularity.mean() # ---> 53.01
median_popularity = popularity.median() # ---> 61.0
bins = [10, 20, 30, 40, 50, 60, 70, 80, 90, 100]
plt.hist(popularity, bins=bins, edgecolor="black")
plt.title("Song Popularity Level According to Spotify")
plt.xlabel("Popularity Range")
plt.ylabel("Number of Songs")
plt.axvline(mean_popularity, color='red', label="Popularity Mean")
plt.axvline(median_popularity, color='yellow', label="Popularity Median")
plt.tight_layout()
plt.legend()
We can quickly see that songs that came out within the past ten years (2010–2020) greatly outnumber any other decade. The oldest song was released in 1960 and the most recurring year in the trending list was 2020.
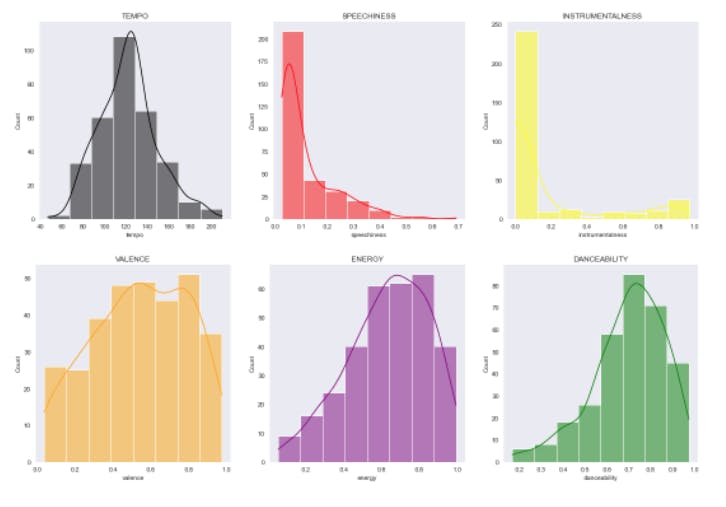
What audio features make a trending song?
audio_names = ['danceability', 'energy', 'key',
       'loudness', 'mode', 'speechiness', 'acousticness', 'instrumentalness',
       'liveness', 'valence', 'tempo']

sns.set_style('dark')
sns.displot(df.danceability, kde=True, bins=8, color='green').set(title='DANCEABILITY')
sns.displot(df.energy, kde=True, bins=8, color='purple').set(title='ENERGY')
sns.displot(df.valence, kde=True, bins=8, color='orange').set(title='VALENCE')
sns.displot(df.instrumentalness, kde=True, bins=8, color='yellow').set(title='INSTRUMENTALNESS')
sns.displot(df.speechiness, kde=True, bins=8, color='red').set(title='SPEECHINESS')
sns.displot(df.tempo, kde=True, bins=8, color='black').set(title='TEMPO')
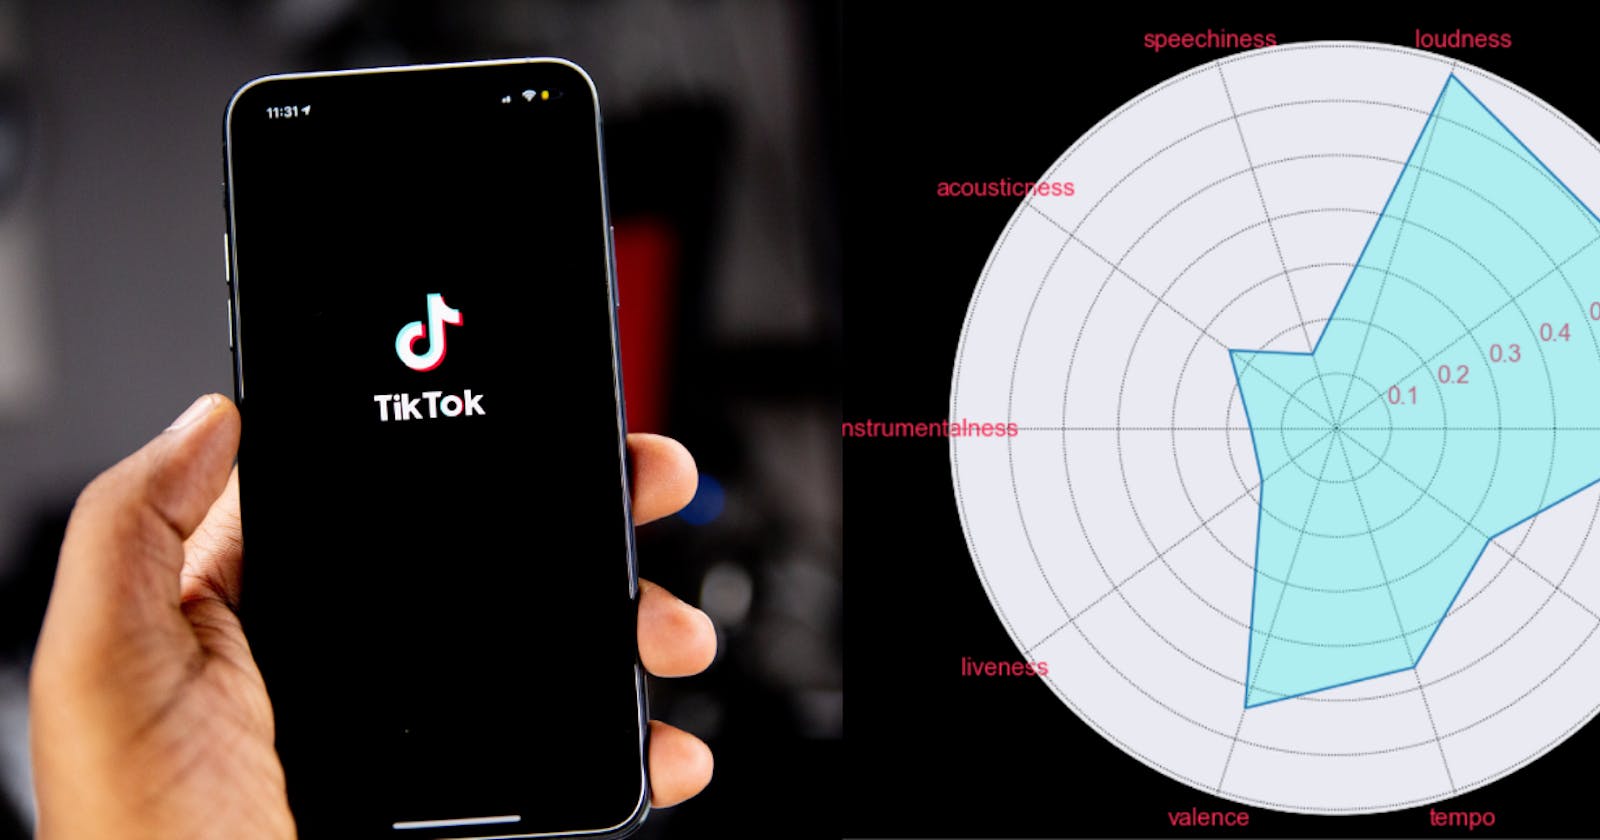
audio_features_radar_chart = audio_features_df[['danceability', 'energy', 'loudness', 'speechiness',
       'acousticness', 'instrumentalness', 'liveness', 'valence', 'tempo', 'duration_ms',
       ]]

min_max_scaler = MinMaxScaler()
audio_features_radar_chart.loc[:]=min_max_scaler.fit_transform(audio_features_radar_chart.loc[:])

# Plot the size and set the colors of the graph
fig=plt.figure(figsize=(12,8), facecolor="black", edgecolor="black")

# convert audio feature names into a list
categories=list(audio_features_radar_chart.columns)
# Store their count in a variable
N=len(categories)

# Establish a list of averages for each audio feature
value=list(audio_features_radar_chart.mean())

# Since the plot will essentially be a closed circile, we will need to repeat the first item
# And then we'll append that first item back to the list to close the circle.
value+=value[:1]
# Calculating the angle for each category
angles=[n/float(N)*2*pi for n in range(N)]
angles+=angles[:1]

# Plot the radar chart with respective angles. Add colors and design.
plt.polar(angles, value)
plt.fill(angles,value,alpha=0.3, color="#25F4EE")
plt.grid(True,color='k',linestyle=':')


plt.title('TikTok Trending Audio Features', size=35, color="white", pad=40)
plt.xticks(angles[:-1],categories, size=15)
plt.xticks(color='#FE2C55',size=15)
plt.yticks(color='#FE2C55',size=15)
plt.tight_layout()
plt.show()
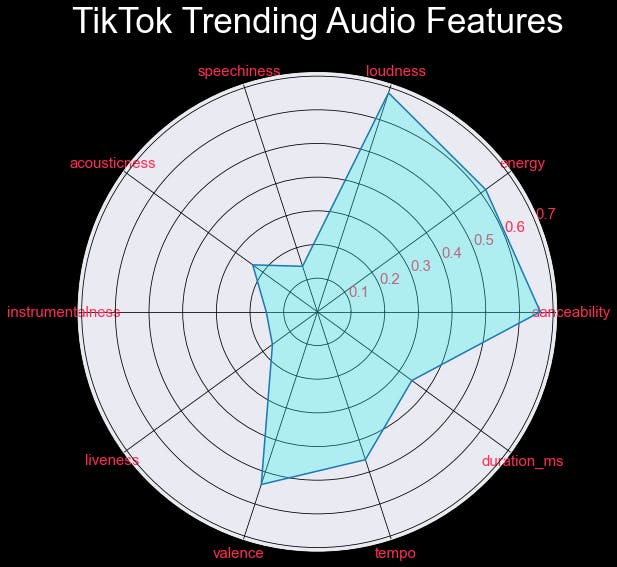
And there we have it! We can see that trending songs on TikTok tend to lean towards the songs that are loud, danceable, and highly energetic. Instrumental and acoustic songs seem not perform so well. You can view the full notebook here.
Conclusion The dataset for this project was taken from one month during 2019. For the next step, one could compare how or if this trend has changed in the past 2 years. Tokboard is a website that follows and ranks the trending songs and, according to the website, is “ powered by a data-collection engine which is constantly fetching data from the TikTok platform. The database now contains data points for more than 80 million top videos and 5 million users, taking up more than 50 gigabytes for metadata alone.” One could utilize such data to analyze and compare features of trending songs or even use machine learning to predict or guess how well a song would do on TikTok.
As TikTok continues to grow, the data around it will continue to grow as well. Please feel free to share other project ideas that could utilize TikTok data in the comments section.